Resources
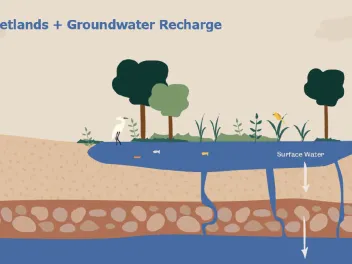
This infographic illustrates how wetlands help recharge the groundwater that supplies cities, towns, rivers, and streams.
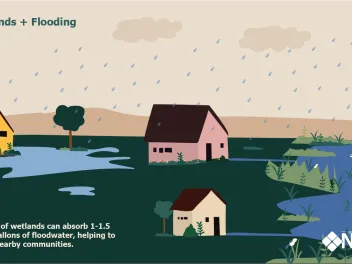
This infographic illustrates how wetlands help prevent catastrophic flooding.
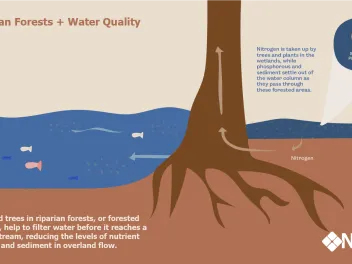
This infographic illustrates how forested wetlands help reduce nutrient pollution and sediment before it reaches nearby rivers or streams.
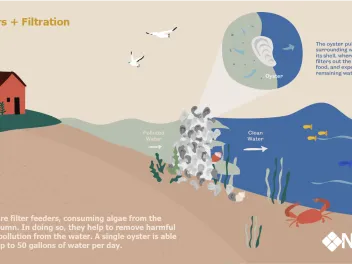
This infographic illustrates how oysters are able to filter polluted water.
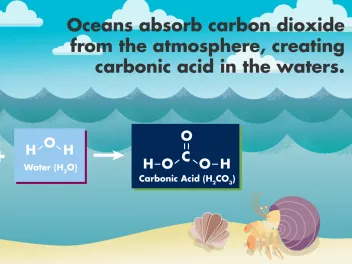
These infographics show the chemical process of ocean acidification.
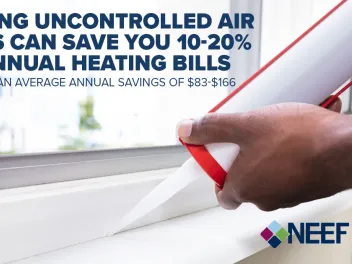
This NEEF-RMI shareable graphic shows how sealing uncontrolled air leaks can save you up to 20% on heating annually.
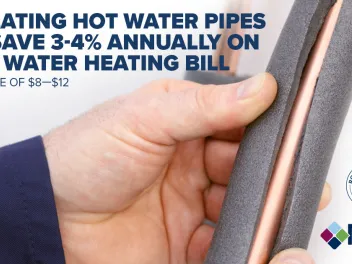
This NEEF-RMI shareable graphic shows how insulating hot water pipes can save you up to 3-4% on heating annually.
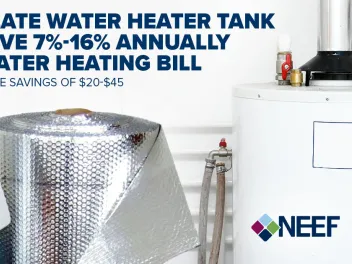
This NEEF-RMI shareable graphic shows how insulating your water heater can save you up to 16% on heating annually.
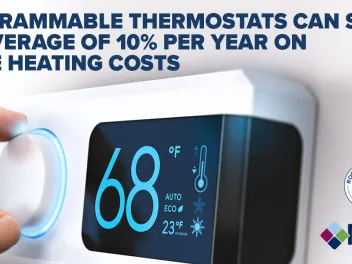
This NEEF-RMI shareable graphic shows how a programmable thermostat can save you an average of 10% on heating annually.
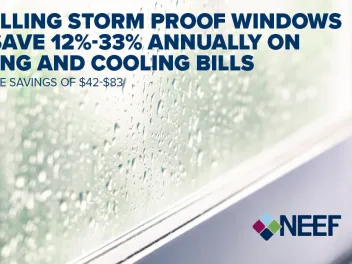
This NEEF-RMI shareable graphic shows how storm proof windows can save you up to 33% on heating annually.