Did you know?
- Climate-related temperature shifts are expected to cause a net increase in residential electricity use.
- Heating and cooling account for roughly 48% of average annual US household energy use.
Monthly and annual global temperatures have increased since the 1900s. Degree days is a term used to relate daily temperatures to the demand for electricity to heat or cool buildings. The graph below from the US Global Change Research Program shows there's been an increase in cooling days and a decrease in heating days over the last 20 years.
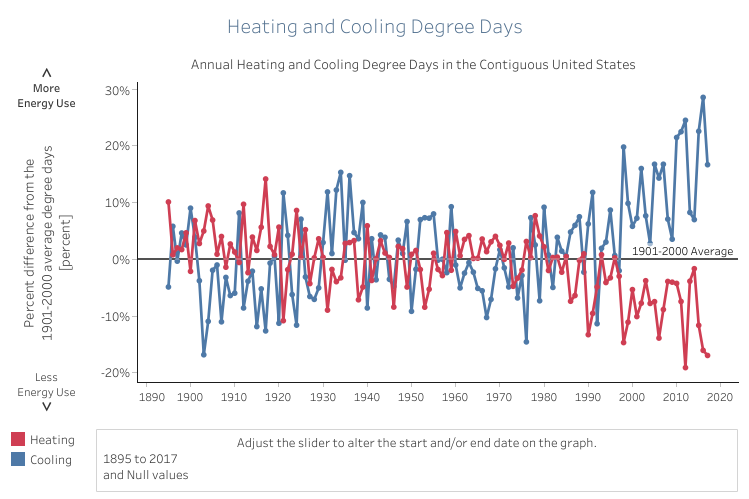
With annual temperatures projected to continue increasing into the future, energy demand for cooling buildings will increase in the summer and energy demand for heating buildings will decrease in the winter. Studies suggest that increasing electricity demands for cooling will exceed lower electricity savings resulting from lower energy demands for heating.
Other factors that affect energy demand for heating and cooling include population change, energy prices, consumer behavior, and conservation programs. These impacts, along with degree days, differ among regions of the United States, but the demands for electricity for cooling are expected to increase in each region as a result of increases in average temperatures.
What you can do
- Improving energy efficiency in your home can help to reduce energy costs and emissions. EPA offers tips to heat and cool your home more efficiently.
- Depending on where you live, a few smart landscaping choices can help you weather hot and cold temperatures, chilly winds, and water shortages.
Learn More
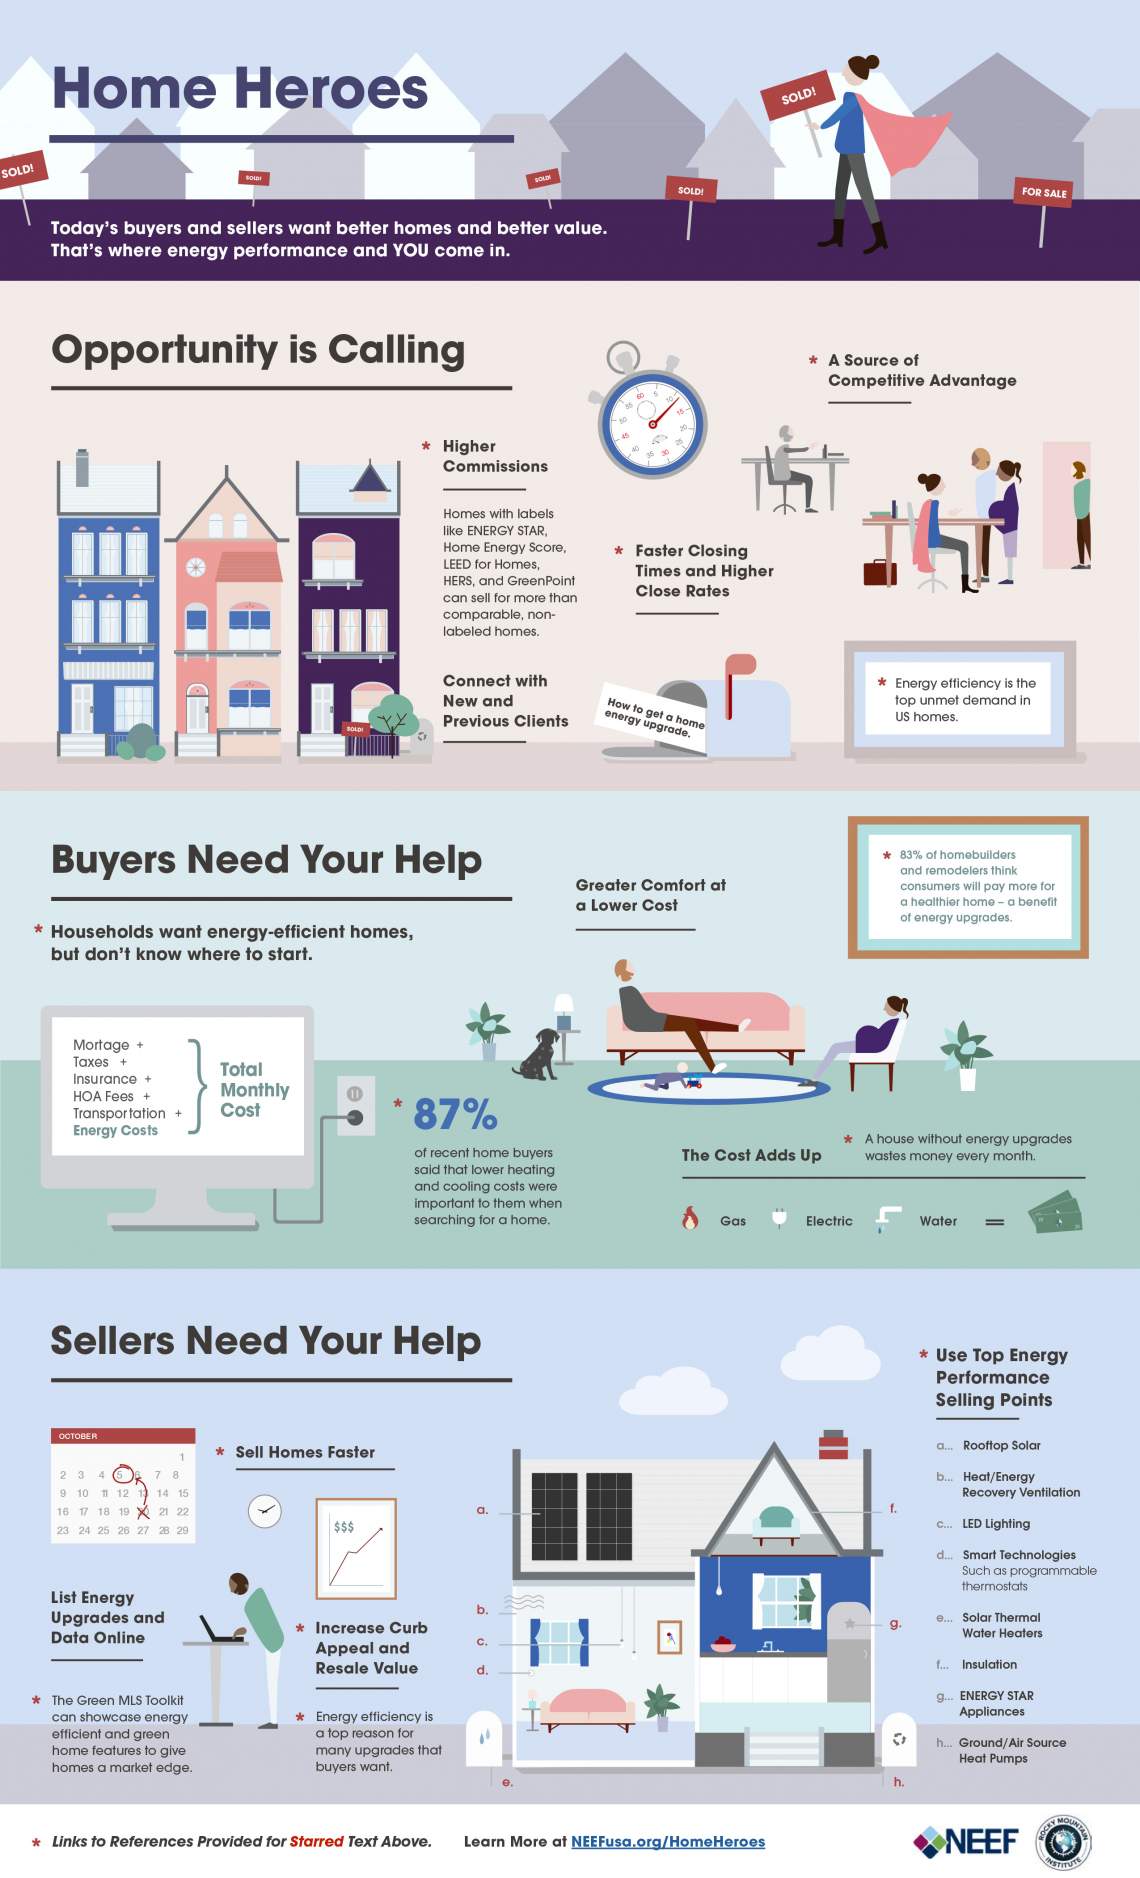
Explore the Home Heroes infographic created by NEEF and Rocky Mountain Institute (RMI) to discover how home buyers and sellers can get the better homes and better value they want through home energy performance. The infographic is designed around three main themes “ opportunity is calling, buyers need your help, and sellers need your help," to encourage and help real estate professionals promote the benefits of improved energy performance among buyers and sellers.
Click on the infographic for an interactive version or to download a copy.
Sources:
- EPA. 2015. "Climate Action Benefits: Electricty Demand." Accessed August 8, 2016. http://www2.epa.gov/cira/climate-action-benefits-electricity-demand
- EPA. 2016. “Climate Change Indicators: Heating and Cooling Degree Days.” Accessed August 8. https://www.epa.gov/climate-indicators/climate-change-indicators-heating-and-cooling-degree-days
- EPA. 2016. "Climate Change Indicators in the United States: Heating and Cooling Degree Days." Accessed December 4, 2018. https://www3.epa.gov/climatechange/science/indicators/health-society/he…;
- NASA. 2015. “The 10 Warmest Years: Not Exactly Forever Ago.” Accessed August 8, 2016. http://climate.nasa.gov/blog/2224
- NCA. 2014. “Energy: Climate Change and Seasonal Energy Demands.” Accessed August 8, 2016, http://nca2014.globalchange.gov/report/sectors/energy
- NOAA. 2015. “Global Analysis: September 2015.” Accessed August 8, 2016, https://www.ncdc.noaa.gov/sotc/global/201509
- NOAA. 2016. “National Overview – June 2016.” Accessed August 8. http://www.ncdc.noaa.gov/sotc/national/201606
- NOAA. 2018. “When average temperature misses the mark.” Accessed December 4, 2018, https://www.climate.gov/news-features/blogs/beyond-data/when-average-temperature-misses-mark
- USGCRP. 2018. "Heating and Cooling Degree Days." Accessed December 4, 2018. https://www.globalchange.gov/browse/indicators/indicator-heating-and-co…;

